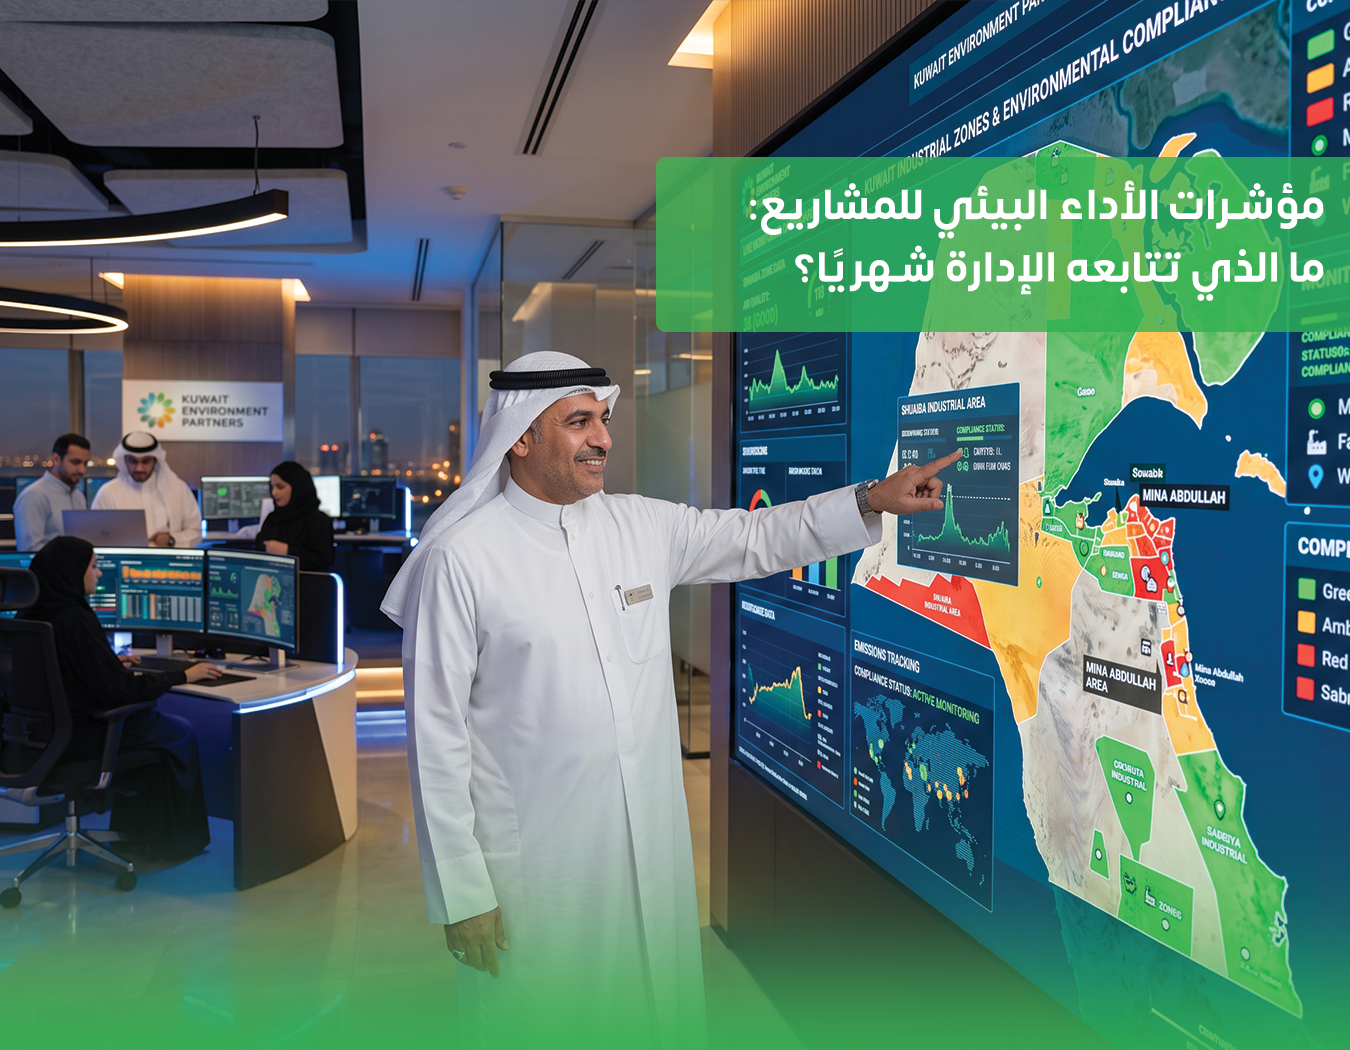

Environmental Performance Indicators for Projects: What Should Management Monitor Monthly?
23 Jul

Environmental Performance Indicators for Projects: What Should Management Monitor Monthly?

Thursday July 23rd, 2026

Management does not need dozens of pages to understand the environmental condition of a project. It needs a limited set of reliable indicators that reveal trends, deviations, responsibility, and the decisions required.

When Environmental Performance Indicators in Kuwait are designed correctly, data related to waste, measurements, complaints, training, and observations becomes a monthly decision-making dashboard that connects field performance with the Environmental Management Plan, owner requirements, and the requirements of the relevant authorities.

Quick Answer

Management should monitor monthly indicators that reveal the level of control over environmental risks and the effectiveness of implemented measures, including:

  • Waste quantities and disposal routes.
  • Monitoring and measurement results.
  • Water and energy consumption.
  • Complaints and incidents.
  • Closure of environmental observations.
  • Contractor performance.
  • Training.
  • Permit status.

Each indicator should have:

  • A clear definition.
  • Data source.
  • Owner.
  • Baseline.
  • Target.
  • Escalation threshold.

The value of an indicator is not in the number alone, but in the decision it generates when performance deviates.

What Are Environmental Performance Indicators in Kuwait?

An Environmental Performance Indicator is a recurring measurement that shows the status of an important environmental aspect of a project or facility, such as:

  • Waste generation.
  • Air quality.
  • Water consumption.
  • Speed of closing observations.

An indicator may be quantitative, such as:

Waste generated per unit of production

or a controlled qualitative indicator, such as:

Percentage of completed inspection records

or:

Level of corrective-action implementation

Raw data should be distinguished from an indicator.

For example:

  • Number of waste containers.
  • Instrument readings.

are raw data.

An indicator connects that information to:

  • A reporting period.
  • Work volume.
  • Target.
  • Performance limit.

This gives the data management meaning.

Collecting large quantities of numbers is therefore not useful if they cannot be compared, verified, and interpreted.

Why Does Management Need Indicators Instead of Long Reports?

A lengthy report may describe everything that happened during the month without clearly showing:

  • Where risk changed.
  • What was delayed.
  • Who needs to act.
  • What decision is required.

A dashboard summarizes the message through trends and exceptions:

  • What improved?
  • What deteriorated?
  • Why?
  • What decision is required?

It does not replace the technical report.

Instead, it guides the reader toward supporting evidence and technical details where needed.

Indicators also help compare:

  • Contractors.
  • Project areas.
  • Project phases.

provided that definitions are standardized.

For example, if one team records a complaint when it is received while another records it only when it is closed, the comparison will not be fair.

For this reason, dashboard development should begin with an indicator dictionary, not with colors and charts.

How Do You Select the Right Indicators for a Project?

Start with:

  • Significant environmental aspects.
  • Compliance obligations.
  • Contractual requirements.
  • Environmental Management Plan.
  • Risk-assessment results.

Ask:

  • What events or trends does management need to know about early?
  • What reliable data is available?

Then select a combination of:

Lagging Indicators

These measure what has already happened, such as:

  • Number of spills.

Leading Indicators

These measure whether controls are being implemented before an impact occurs, such as:

  • Percentage of storage areas inspected on schedule.

Avoid indicators that can be improved superficially without producing real improvement.

For example, increasing training hours means little if waste-segregation errors continue.

A stronger indicator combines activity and effectiveness, such as:

Percentage of workers who passed a practical assessment after training and demonstrated fewer errors during inspections.

Waste and Material Indicators

The dashboard may include:

  • Waste quantity by type.
  • Correct segregation percentage.
  • Waste generated per unit of activity.
  • Number of temporary-storage capacity exceedances.
  • Completeness of transportation and handover documentation.
  • Waste-mixing cases.
  • Incorrect labeling cases.

Changes in waste quantities should be interpreted according to:

  • Project progress.
  • Production level.

so that increases or decreases are not taken out of context.

Also monitor:

  • Waste retention time on site.
  • Condition of storage areas.
  • Integrity of secondary containment for liquids.

Where appropriate, these indicators can be linked to SSG’s Environmental Management Plan Preparation and waste-management procedures so that results are converted into practical controls and responsibilities.

Monitoring, Measurement, and Emission Indicators

Indicators may include:

  • Measurements completed versus planned.
  • Percentage of results within applicable criteria or project limits.
  • Instrument calibration status.
  • Report issuance time.
  • Number of exceedances.
  • Actions associated with exceedances.

Environmental performance should not be reduced to one average value that may conceal:

  • A high individual reading.
  • A sensitive location.
  • A recurring problem.

Results related to:

  • Air.
  • Noise.
  • Water.
  • Soil.

should be linked to:

  • Measurement location.
  • Operating conditions.
  • Weather conditions where relevant.

SSG’s Environmental Testing and Analysis services can support the development of an appropriate monitoring program and interpretation of results in the context of the project instead of relying on isolated measurements that do not answer a management question.

Water, Energy, and Resource Indicators

Monitor:

  • Total consumption.
  • Specific consumption per unit of production.
  • Consumption per square meter.
  • Consumption per operating hour.

depending on the nature of the activity.

Separate:

  • Different sources.
  • Major uses.

Specific consumption is more useful when activity levels vary, while total consumption remains important for:

  • Planning.
  • Invoices.
  • Capacity.

Analyze:

  • Leaks.
  • Abnormal readings.
  • Meter differences.

Determine whether savings are caused by:

  • Real efficiency improvements.
  • Reduced activity or shutdown.

Additional indicators may include:

  • Percentage completion of efficiency initiatives.
  • Verified savings value.

The calculation method and baseline period should be clearly defined.

Complaint, Incident, and Observation Indicators

Do not monitor only the number of complaints.

Also monitor:

  • Complaint type.
  • Location.
  • Response time.
  • Investigation duration.
  • Recurrence rate.
  • Complainant satisfaction where appropriate.

For incidents and spills, monitor:

  • Impact severity.
  • Containment speed.
  • Investigation completion.
  • Corrective-action implementation.
  • Effectiveness verification.

For environmental observations, useful indicators include:

  • Percentage closed on time.
  • Average age of open observations.
  • Number of recurring cases.
  • Percentage of actions that passed effectiveness verification.

If the number of open cases decreases while the same cause continues to recur, closure may be administrative rather than genuine improvement.

Contractor Performance and Training Indicators

Contractors may be evaluated through:

  • Inspection results.
  • Timely submission of records.
  • Observation closure.
  • Environmental incidents.
  • Complaints.
  • Supervisor competence.
  • Percentage of qualified workers assigned to sensitive activities.

Evaluation rules should be:

  • Known.
  • Consistent.
  • Proportionate to the contractor’s scope.
  • Appropriate to workforce size.

For training, combine:

  • Attendance.
  • Understanding assessment.
  • Field observation after training.

If incorrect behavior continues, review:

  • Training content.
  • Delivery method.
  • Supervision.

Do not treat a signed attendance sheet as sufficient evidence of competence.

How Do You Define an Owner and Data Source for Each Indicator?

Create an indicator card containing:

  • Indicator name.
  • Definition.
  • Purpose.
  • Calculation formula.
  • Unit.
  • Frequency.
  • Data source.
  • Data owner.
  • Reviewer.
  • Baseline.
  • Target.
  • Escalation thresholds.

The owner is responsible for:

  • Data quality.
  • Initial analysis.

The raw source may come from:

  • Warehouse.
  • Laboratory.
  • Contractor.
  • Finance.

Set a clear deadline for monthly data closure and define how late corrections are handled.

Any change in:

  • Definition.
  • Data source.

should be documented to preserve historical comparability.

The dashboard should use one approved source rather than several uncontrolled copies distributed across:

  • Emails.
  • Personal spreadsheets.

Data Governance and Verification Before Presentation

Review:

  • Completeness.
  • Accuracy.
  • Consistency.
  • Timeliness.
  • Traceability.

Use logical checks, such as:

  • Comparing monthly waste with activity level.
  • Comparing consumption with meter readings and invoices.
  • Reviewing samples of contractor records.

Document every:

  • Estimate.
  • Assumption.

Do not mix measured and estimated values without disclosure.

Important figures should have supporting evidence with:

  • Controlled access.
  • Approval.
  • Modification history.

If data is incomplete, clearly state this instead of presenting an unreliable figure with an appearance of precision.

Simple Monthly Dashboard Model

A dashboard can begin with a single page containing:

  • Executive summary.
  • Five to ten key indicators.
  • Three-month or twelve-month trend.
  • Explanation of deviations.
  • Actions with owners and deadlines.

Use color only as a supporting signal.

A green status should not hide a steadily deteriorating trend simply because the formal limit has not yet been exceeded.

Add a section for:

Management Decisions Required

For example:

  • Approve a supplier.
  • Increase monitoring frequency.
  • Temporarily stop an activity.
  • Provide additional waste containers.
  • Modify a contractor agreement.

This turns the monthly review into a management tool rather than a presentation session.

How Do You Link Indicators to the Environmental Management Plan and Sustainability Report?

The Environmental Management Plan defines:

  • Controls.
  • Programs.
  • Monitoring.
  • Responsibilities.

The dashboard should therefore derive its indicators from these elements and feed implementation results back into the plan.

When preparing a Sustainability Report, verified operational data and annual trends can be used instead of starting an unstructured collection exercise at the end of the year.

However, figures should not be transferred directly into an external report without reviewing:

  • Boundaries.
  • Methodology.
  • Period.
  • Definitions.

Operational data may need:

  • Aggregation.
  • Reclassification.

to suit the purpose of public disclosure.

Claims that are not supported by evidence should be avoided.

How Do Indicators Support Management Decisions?

Trends help management:

  • Allocate resources according to risk.
  • Identify contractors or areas requiring intervention.
  • Select audit topics.
  • Evaluate the effectiveness of initiatives.
  • Forecast storage requirements.
  • Forecast monitoring requirements.
  • Forecast training needs.

They also provide evidence of management follow-up during reviews by:

  • Project owner.
  • Competent authority.

A good KPI meeting should end with clear decisions.

Each deviation should state:

  • Immediate or root cause.
  • Required action.
  • Owner.
  • Deadline.
  • Whether escalation is required.

The following month’s review should begin with the status of these decisions.

Common Mistakes to Avoid

Common mistakes include:

  • Using too many indicators without prioritization.
  • Changing definitions without documentation.
  • Showing cumulative figures that do not support monthly decisions.
  • Comparing contractors with different scopes without adjustment.
  • Using percentages without showing numerator and denominator.
  • Delaying data until it loses decision-making value.
  • Linking rewards to one indicator and creating pressure to hide cases.
  • Showing averages that hide extreme values.
  • Assuming that the absence of complaints proves the absence of environmental impacts.

Indicators should therefore be balanced and verified through field observations.

How Can SSG Help?

SSG can:

  • Review the Environmental Management Plan.
  • Review data sources.
  • Identify appropriate indicators.
  • Develop an indicator dictionary.
  • Prepare KPI cards.
  • Build a monthly dashboard.
  • Train data owners on collection and analysis.
  • Link indicators with monitoring and sustainability reporting.

The dashboard can also be integrated with Environmental Supervision of Construction Projects to help verify that reported data reflects actual site conditions.

The scope depends on:

  • Type of activity.
  • Project stage.
  • Risks.
  • Contractual requirements.
  • Regulatory requirements.

The objective is a practical monitoring system that management can use and maintain, rather than a complicated dashboard dependent on one person.

Steps to Request the Service From SSG

Start by sharing:

  • Project overview.
  • Environmental Management Plan.
  • Current reports.
  • Contractor list.
  • Data sources.
  • Objectives.

After an initial review, the scope may include:

  • KPI workshop.
  • Data-gap analysis.
  • Dashboard design.
  • Ongoing monitoring support.

Definitions and responsibilities are then approved and tested using a previous month’s data.

Gaps are corrected before launch.

You can contact SSG to determine the appropriate scope according to project size and data availability.

Practical Scenario: Building a Dashboard During a Monthly Cycle

During the first week, the environmental team meets with:

  • Operations.
  • Warehouse.
  • Contractors.

to confirm:

  • Environmental aspects.
  • Obligations.
  • Data sources.

A sample of the previous three months is reviewed to test data quality.

The team identifies:

  • Indicators that can be calculated immediately.
  • Indicators whose data sources need improvement.

Do not start designing the final dashboard before resolving differences in definitions.

A visually attractive dashboard cannot correct:

  • An untraceable figure.
  • An unfair comparison between different sites.

During the second week, indicator cards are prepared and the calculations are tested manually.

Each data owner is asked to recalculate their indicator directly from the source.

The team then discusses abnormal values:

  • Was activity level different?
  • Was there a data-entry error?
  • Did an actual event occur?

Escalation thresholds are defined based on:

  • Risks.
  • Obligations.
  • Objectives.

Avoid arbitrary limits selected only to produce dashboard colors.

During the third week, a trial dashboard is presented to management using three types of messages:

  1. Performance status.
  2. Causes of deviation.
  3. Decisions required.

If the manager needs to open five different files to understand one KPI, the dashboard has not yet succeeded.

Each note should contain enough information to support a decision while linking to the technical report or supporting record for anyone who needs further verification.

At the end of the month, review the effectiveness of the meeting itself:

  • How many decisions were issued?
  • How many actions were closed?
  • Which indicators were not used?
  • Which data arrived late?

Remove indicators that do not provide value or redefine them.

Add a new indicator only when it has:

  • A user.
  • A responsible owner.
  • A reliable source.

Through this cycle, the dashboard becomes a learning and improving management system rather than a fixed template repeated every month without value.

Practical Monitoring Table

Indicator Monitoring Method Source Escalation Decision
Specific waste generation Waste quantity ÷ unit of activity Weight and handover records Unexplained increase or waste mixing
Monitoring implementation Completed measurements ÷ planned measurements Monitoring program and reports Delay or non-compliant result
Observation closure Closed on time ÷ actions due Action register Delay or recurring cause
Water consumption Consumption ÷ unit of activity Meters and invoices Sudden increase or potential leak
Contractor performance Inspection, closure, and training score Site reports Repeated deterioration
Complaints Number, response time, and recurrence Complaint register Recurring or sensitive complaint

Practical Checklist

  • ☐ Indicators are linked to environmental aspects, obligations, and contractual requirements.
  • ☐ Each indicator has a definition, formula, unit, source, and owner.
  • ☐ Baseline, target, and escalation thresholds have been defined.
  • ☐ A verification mechanism and evidence sample exist for every major figure.
  • ☐ The dashboard shows trend and interpretation, not numbers alone.
  • ☐ Every deviation is linked to an action, responsible person, and deadline.
  • ☐ Rules for comparing contractors and project areas are standardized.
  • ☐ Indicators are reviewed whenever activities or risks change.

Frequently Asked Questions About Environmental Performance Indicators in Kuwait

How Many Environmental Performance Indicators Should Be Used?

There is no fixed number.

Select a limited set that covers:

  • Key risks.
  • Compliance obligations.
  • Main management decisions.

More detailed indicators can be added where necessary without overwhelming management.

Is Monthly Reporting Enough?

The frequency depends on the risk.

Some indicators may require:

  • Daily monitoring.
  • Weekly monitoring.

and then monthly summarization for management.

Other indicators may be suitable for quarterly review.

What Is the Difference Between a Leading Indicator and a Lagging Indicator?

A leading indicator measures implementation of a control before an environmental impact occurs, such as:

  • Inspection.
  • Training.

A lagging indicator measures what actually happened, such as:

  • Spills.
  • Complaints.

A balanced system should use both.

How Should Incomplete Contractor Data Be Managed?

Define:

  • Requirements.
  • Submission deadlines.

within the contract.

Review supporting evidence and record missing information as a contractor-performance issue.

Do not replace missing data with unsupported estimates without clear disclosure.

Can the Project Dashboard Be Used for the Sustainability Report?

It provides an important basis, but before using the data for annual disclosure, review:

  • Boundaries.
  • Definitions.
  • Reporting period.
  • Methodology.

When Is an Environmental Consultant Needed?

External support can be useful when:

  • Definitions are inconsistent.
  • Data conflicts.
  • Indicators do not lead to decisions.
  • KPIs need to be linked with the Environmental Management Plan.
  • KPIs need to be linked with environmental monitoring.
  • Data needs to support sustainability reporting.

Start Reviewing Your Project Requirements With SSG

If your project requires an environmental review, study, or compliance plan in Kuwait, you can contact SSG to review the requirements and determine the appropriate scope of service according to the type of activity, implementation stage, and competent authority.